Horsepower in automotive terms is the application of a force at a certain speed. If you double the speed but halve the force, you are producing the same horsepower. If you double the force but halve the speed – again the horsepower is the same.
Let’s look at the driving force that gets applied to the tire, since really that is all that matters – right?
What we are going to do now is map out the turning force a sample engine will provide to the wheels throughout the gear, creating what is called a Tractive Effort graph, which as the name implies shows the amount of traction needed to put the power to the ground without wheel spin. It will also hopefully make clear to you what horsepower tells us, and why it is so important.
So let’s look at the power graph of our sample engine, a very torque-y low revving engine:

For the simplicity of the math I made this example engine only rev to 5000rpm, and have coupled it with the following example drive-train gearing (also selected for simple math):
1st: 3:1
2nd: 2.5:1
3rd: 2:1
4th: 1.5:1
5th: 1:1
6th: 0.75:1
Final: 4:1
Tire Rollout: 2000mm (the distance covered with one rotation of the tire)
This leaves us with a top speed in each gear as follows (notice how our simple math has given us nice round numbers):
1st: 50km/h
2nd: 60km/h
3rd: 75km/h
4th: 100km/h
5th: 150km/h
6th: 200km/h
To map out our tractive effort for 1st gear we simple take our torque and multiply it by the total gear ratio for 1st: 3:1 (Gear) * 4:1 (Final) = 12:1, and scale the resulting graph to go between 10km/h (at 1000rpm) and 50km/h (which is 5000rpm). Our peak torque at the engine is 340lb/ft at 3000rpm, and our peak axle torque in 1st will be 12 times that, or 4080lb-ft at 30km/h:

1st Gear Axle Torque – The dot represents peak HP – 4000rpm @ 40km/h in 1st – Click to zoom
Wow! That’s a lot of torque, but we’re not going very fast. Let’s overlay second gear using the same math and see what we can learn:

Axle Torque In 2nd – Dot represents peak HP which occurs at 4000rpm, 48km/h – Click to zoom
Now we are learning something. Let’s plot the rest of the gears:
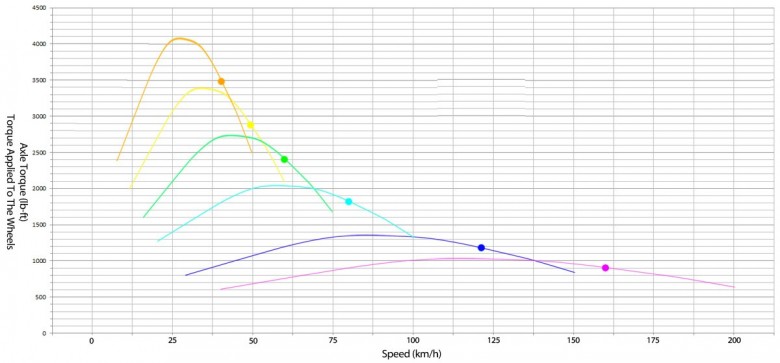
Axle torque for all gears – Click to zoom
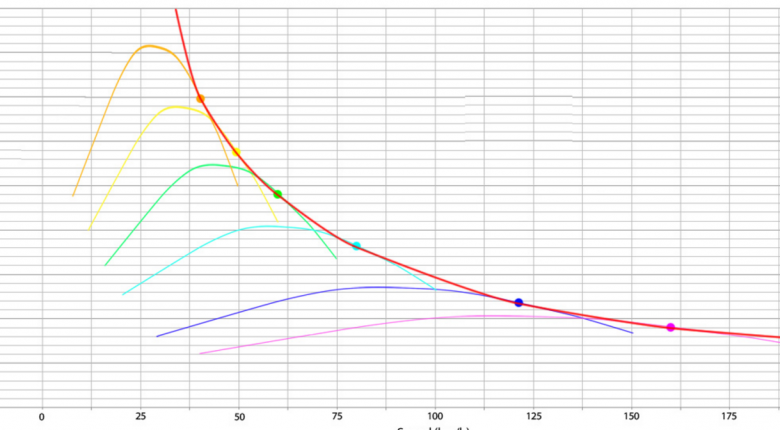
Now here’s the next big takeaway. We have the highest torque to the wheels at all speeds if we stay as close to peak HP as possible. In fact, a perfectly efficient drive-train would keep the engine at peak HP at all speeds and the tractive effort would look like this red line:

The axle torque applied at various speeds at peak HP – Click to zoom
Notice the gaps under the red-line between our different gears? That is where we are far away from peak HP.
Now for the final big takeaway from this lesson:
Peak torque of the engine is of no interest to the ideal tractive effort curve – that is because maximum acceleration will be realized with shorter gearing and higher engine speed, despite the lower engine torque. In other words, all we care about is staying as close to peak HP as possible, and letting the gearing make up for the lost torque at the engine!
Let’s look at an example. Say you are at a track day receiving driving lessons. You’re in the driver seat, with a coach next to you and you’re accelerating at full steam leaving a corner at 80km/h. If we look at our tractive effort graph above, we can see that we are at PEAK TORQUE in 5th gear! Great. We should get a strong shot out of the corner at peak torque right? At least that’s what your driving instructor is telling you.
But your gut says something is wrong…you feel like you have very little pull, and 4th sure seems to pull a heck of a lot harder, despite being well past the engine’s peak torque.
So let’s look at our tractive effort graph: at 80km/h, we can use 5th gear and apply roughly 1450lb-ft of torque to the axle, or we can use 4th gear and apply 1700lb-ft of torque! That’s 17% more torque to the ground, and guess what, our HP at 80km/h is 17% higher in 4th than it is in 5th.
So there you have it, understand gears, understand horsepower. Go faster.
Now let’s look at one more example. The confused engine enthusiast who claims a “flat torque curve” is the perfect and ideal output for an engine. Well, with a very close ratio gearbox I will agree, the engine builder should do what they can to maximise horsepower, even at the expense of torque. But for those of us with factory long gears, we need a wide powerband – in other words, maximum average HP across the RPM within which we will be operating. Let’s look at a tractive effort graph of what some would consider the “theoretically perfect” engine – one with a totally flat torque curve:
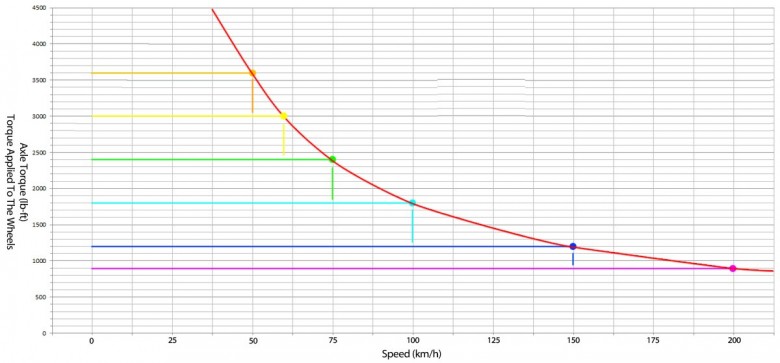
Some believe a flat torque curve is “ideal” – Looking at a tractive effort graph we can see how that is most certainly not true.
Some believe a flat torque curve is “ideal” – Looking at a tractive effort graph we can see how that is most certainly not true.
You can see there are huge gaps between the gears, and the gears don’t fill out the area under the red line nearly as well as our previous example engine. So what is the advantage of a flat torque curve? Well, it allows the driver to know that no matter what RPM they leave the corner at, they will have more or less the same force applied to the wheels, this can make a car easier to drive.
Now to bring this back to being about horsepower, a flat torque curve results in the maximum HP being at the rev limiter. This should be intuitive to you now, as we know horsepower is torque * speed. So if engine speed is increasing with no loss of torque, power will obviously be going up. This means our ideal power curve will touch on the rev limiter of each gear (as you can see the red curve does above).
The loss of horsepower after a gear change is astounding, at rev limiter we have 286hp (300lb-ft of torque at 5000rpm), and shifting from 4th to 5th results in a drop from 286hp to 190hp! In terms of tractive effort the drop in axle torque is from 1800lb-ft to 1200lb-ft.
So this re-enforces the statement that average power is very important, not just peak power. A flat torque curve will have very poor average power as the power is always climbing rapidly with RPM (or falling rapidly with a loss of RPM).
So to conclude, you should remember that engine torque is a measurement that is not of much interest to us, as horsepower and the shape of the horsepower curve is what is used to determine acceleration potential. A ton of torque that occurs well outside of the usable power-band is useless and potentially dangerous to the engine as it creates very high cylinder pressures.
I hope this helped you all get a deeper understanding of the forces that propel your car around the racetrack, and how to maximize them.
Visit Sasha's OnPoint Dyno website for more tech articles and motorsport knowledge.