354 | Introduction to Data Logging
Summary
Data logging is one of the most important tools available to us when it comes to optimising the performance of the car, driver, or even just ensuring engine health and reliability. In this webinar we’ll have an introductory look at data logging systems, what you need, and what sensors to consider.
| 00:00 | Hey team, Andre from High Performance Academy here, welcome to another one of our webinars and this time we're going to be diving into the world of data logging and data analysis. |
| 00:08 | And probably at this stage just about everyone's seen dash loggers like this MoTeC C125, or we've also got an Ecumaster ADU7. |
| 00:19 | So, these have sort of become commonplace, particularly in the higher levels of amateur motorsport, and obviously just about any professionally built racecar is going to have something similar. |
| 00:31 | That is however only one option when it comes to data logging and data analysis, and fortunately there are some really viable cheap entry level products which is also what we're going to be talking about today. |
| 00:43 | As usual, we're going to have a question and answer session at the end of the lesson so if there's anything that I talk about today that you want a little bit more knowledge on or for that matter anything generally related to the topic of data logging and analysis, then please ask those questions and we'll get into those at the end. |
| 01:00 | To start with, why do we even need data logging and data analysis? Well, I should really go without saying, but the reality is that when we're out on the racetrack it's very very difficult to remember exactly what happened and in what order. |
| 01:16 | Particularly, if you're doing a session that might be 20 minutes or even an hour long, it's very difficult for you to remember back to what you did on lap six and how that differed to what you did on lap 48. |
| 01:27 | So, it's just not practical. |
| 01:29 | There's also a range of different actual things or elements of the car that we want to log and analyse. |
| 01:36 | So, depending what we actually want to see will obviously require different channels and again some of these will be not obvious to the driver as well. |
| 01:45 | So, the reality is we just can't analyse everything while we're going around on the racetrack, it's just not possible. |
| 01:51 | And it's really nice to have the flexibility to come back after a session out on the racetrack and actually be able to sit down with the laptop and go through each of the laps or each of the pieces of data and get a better understanding of what was happening to the car. |
| 02:06 | Now, this also comes down to analysing engine performance and engine reliability metrics. |
| 02:12 | Obviously, in order to finish a race, you still have to have the engine running at the end of the race; so this can be really useful in picking up on things that are going wrong with the engine and kind of preventative maintenance, fixing these problems before they become larger. |
| 02:29 | So, that's why we want data analysis and data logging. |
| 02:33 | We'll go into now the different types of data analysis and I've kind of mentioned a bit of this already. |
| 02:41 | So, the first one there, the first area that we would want to log and analyse is generally engine performance and engine health. |
| 02:50 | So, there's two sides to this as I see it. |
| 02:52 | One would be analysing the engine reliability. |
| 02:56 | So, we're looking here for things such as engine coolant temperature and oil temperature, are these staying within our ideal bounds or is the engine starting to run a little bit hot, particularly maybe on a hot day? Then we've got other parameters that are really important to us such as fuel pressure and oil pressure. |
| 03:15 | Obviously, if our oil pressure is starting to dip away mid corner or perhaps under heavy braking or acceleration, this could be indicative that we've got some problems with our oil delivery system. |
| 03:26 | This is very common of course with a wet sump which doesn't ideally handle the longitudinal and lateral G force that we get in a competition car. |
| 03:36 | And again, if the oil pressure is dropping away continuously, we can be pretty certain that our engine is not going to lead a long and healthy life. |
| 03:46 | We've also got some parameters around our tuning or engine performance. |
| 03:51 | So, we'd be wanting to monitor engine RPM, throttle position, boost pressure versus our boost target if we're talking about a turbocharged or supercharged engine. |
| 04:00 | We'd also want to be looking at our air fuel ratio or lambda, and potentially if we've got the option, also knock. |
| 04:08 | So, as you can understand there, sort of coming back to my first point, straight away that's a huge amount of data that we'd have absolutely no way of processing on the fly. |
| 04:17 | And a good example of this is if we just look at oil pressure on its own, obviously we can have an oil pressure gauge sitting somewhere in our gauge cluster, but it's really really difficult for the driver to be able to split their attention between driving the car and monitoring that oil pressure gauge closely enough to actually pick up what could only be a 20 to 100 millisecond drop off in oil pressure under cornering. |
| 04:44 | So, the data logging system is going to capture all of that. |
| 04:48 | So, that's our first logging area is our engine performance and health. |
| 04:52 | The next that's really important here is our chassis suspension, braking and aero performance. |
| 05:00 | Basically, looking at how the car or chassis is actually working. |
| 05:04 | Admittedly, this is a little bit more advanced so I'm not going to go into a lot of detail on this, because this particular webinar is really aimed at sort of the entry level of data analysis, not sort of the racecars where there's absolutely an endless budget for every sensor known to man. |
| 05:23 | But it's still worth understanding what we can look at here. |
| 05:27 | So, let's just have a look at a few photos from our Toyota 86. |
| 05:34 | So, we'll jump across to my laptop screen. |
| 05:36 | So, this is a shot, I think of the rear suspension, it is and what we've got here is an Izze-Racing infrared brake temp sensor. |
| 05:46 | We've actually got these on all four corners. |
| 05:48 | Generally, you can get away with just having one at the front and one at the rear axle line, however we do actually find, particularly with ABS equipped cars, that they will work the individual corners of the car quite significantly different with the brakes and hence you can actually get quite a variation in the brake temperature. |
| 06:08 | So, why is this useful? Well what it's going to tell us is the temperature of the brake rotor while the car is on track. |
| 06:15 | This is important because if you're checking the brake rotor temperature back in the pits, can be almost irrelevant because unless you've literally just got off the brakes after a hard braking area and then been able to measure it, the brake temperature will equalise or reach equilibrium and drop quite dramatically quite quickly. |
| 06:36 | So, we're not really seeing the true picture of what's happening on the track. |
| 06:39 | We'll look at some data later and see what this actually looks like, but a really good way of deciding if our braking package is sized correctly and whether we've got enough airflow, cooling airflow to the brakes. |
| 06:52 | And quite often we'll see on professionally built race cars, they will actually have blanking plates for the brake cooling ducts, more specifically in the front splitter. |
| 07:00 | And they will change the size of the blanking plates so letting more or less cooling air to the brakes depending on the specifics of the track that they're going to, whether it's a track with some really big heavy braking zones or maybe not quite so much, or also the ambient temperature on the day. |
| 07:18 | Obviously, the brakes are not going to be beating up on so hard if we're in the middle of winter and we're single digits versus maybe mid 35°C day in the middle of summer. |
| 07:29 | So that's one of the sensors. |
| 07:32 | We'll go into this in a bit more detail but these sensors actually work via CAN as well, which is really nice because simple to wire up, we only need power, earth and then CAN high and CAN low. |
| 07:44 | This simply puts all of the information from the sensor straight onto the CAN bus, which simplifies our wiring dramatically, particularly when we've got, in this case, four of these sensors plus a bunch more. |
| 07:55 | Instead of running wires to every single sensor, taking up a lot of inputs on our dash connector, these just all run off that same bus. |
| 08:05 | Alright moving on, this one is a terrible photo because I managed to take it out of focus but we're trying to look at this little guy here, completely out of focus but you'll get the picture. |
| 08:16 | So, this is another infrared temp sensor from Izze-Racing. |
| 08:19 | And same deal, it's a CAN based sensor. |
| 08:23 | This one is probably a little bit harder to understand without the wheel and tyre in place but what this does is looks at the tread temperature across the tyre while the car's out on the racetrack. |
| 08:36 | So, why do we want this information? Well it allows us to analyse how well we're using the tread of the tyre. |
| 08:44 | And no matter how expensive your racecar is or what tyres you've got on it or whether it's got 200 horsepower or 1500 horsepower, ultimately our performance is always going to be limited by that tyre contact patch and how well we're able to utilise it. |
| 09:01 | So, this in and of itself is a huge area to analyse and there's a lot of detail that goes into it, again I'm not going to go into it in too much depth, but suffice to say what this allows us to do is measure the tyre temperature on the inside of the tread, the centre of the tread and then the outside of the tread. |
| 09:19 | Why do we want to do this? Well those three areas give us an indication whether we've got sufficient camber or maybe we've got too much camber. |
| 09:28 | And it also allows us to analyse whether our tyre pressures are correct. |
| 09:32 | And if that's all the case, if we've got everything right, basically under steady conditions, under heavy cornering, what we should see is a relatively equal tread temperature across those three points. |
| 09:44 | If that's not what we're seeing, that means that we've got some work to do and we can modify either our camber, our tyre pressure or both. |
| 09:52 | Now, traditionally, we'd see this sort of information being gathered when the car comes back into the pits with a tyre pyrometer, which is a little probe that someone in the pits would actually poke slightly into the tread of the tyre and record those measurements. |
| 10:08 | Useful to a degree, but again just like with the brake temperature, you've got a lot of equalising that happens in terms of the tread temperature between the car coming off the last corner and then entering the pits. |
| 10:22 | So, it's not really giving you a very accurate depiction of what's going on with the tyre tread. |
| 10:28 | Some more advanced sensors for engine health as well. |
| 10:32 | Again this is off our 86. |
| 10:35 | So, we've got here a pressure sensor that's on the radiator outlet from the cylinder head so this allows us to monitor coolant pressure. |
| 10:44 | This is really really important on highly strung turbocharged vehicles, because if the cylinder head gasket starts to leak, what happens is combustion pressure will make its way into the cooling system and obviously we're going to end up with a spike in our coolant pressure. |
| 11:02 | And if we monitor this, two aspects to it, first of all we can log it and analyse it at a later point but we're also utilising this particular sensor to bring on a driver warning if our coolant pressure is deemed to be excessive. |
| 11:15 | So, that's basically everything I wanted to sort of focus on with this particular engine. |
| 11:21 | Actually there is another one here as well. |
| 11:24 | As you can see we've got a lambda sensor down in the exhaust runner for number one cylinder. |
| 11:30 | Up here, little bit hard to see but we've actually got two of our exhaust gas temperature sensors as well. |
| 11:36 | So, this is a pretty heavily instrumented vehicle. |
| 11:39 | We've got individual cylinder lambda so we can monitor the air fuel ratio on each cylinder and make individual cylinder trims as required. |
| 11:48 | We're also doing the same with our individual cylinder exhaust gas temperature. |
| 11:51 | Obviously, a little bit excessive for most applications, but it just gives you an idea of what sort of sensors are available. |
| 12:00 | One that I didn't take a photo of there is we've also got laser ride height sensors on the underside of that vehicle. |
| 12:09 | We've got three of those, two at the front in each corner and then one at the rear. |
| 12:13 | So, three laser ride height sensors basically defines a plane and that allows us to then analyse the platform stability and movement of the entire chassis. |
| 12:22 | So, obviously there's a fair bit going on. |
| 12:26 | Anyway, those are more advanced features and sensors and as I mentioned, we're going to be focusing a little bit more on the entry level stuff, the stuff that's going to give you the easy wins, the low hanging fruit if you like on optimising your performance. |
| 12:41 | So, we've talked there about the engine performance, the chassis and aero performance, I haven't talked about aero sensors, but essentially again we can use load cells or even the laser ride height sensors I just mentioned there will allow us to see how the aero performance is working at high speed versus low speed, what it's actually doing to the ride height of the car as we go down a long straight. |
| 13:07 | The last and really the key one that I want to focus on for today is driver performance and driver training. |
| 13:15 | And this is so so valuable to weekend warriors, grassroots racers, etc, even right up to professional drivers will still use data analysis to help find speed in the car. |
| 13:31 | So, even if you look at Formula 1, we've always got two teammates in each of the teams and if one is faster than the other, it's quite common practice for them to start sharing data and setups and find out where a particular driver is faster or slower and once they've highlighted the areas on the track where the particular driver is losing speed, then we can start diving into, which we'll look at in a little bit more detail shortly, we can dive into what is actually causing that difference in speed and that can be very very beneficial to help the slower driver get up to speed. |
| 14:07 | For us in the enthusiast market, there's a few options here as well as to how to find more speed in the car. |
| 14:15 | First, would be if you've just managed to somehow piece together an absolute cracking lap and for some reason you've just gone let's say 3 tenths faster than you've ever been before. |
| 14:26 | Well you can use that reference lap and again we'll look at how we do this. |
| 14:29 | Compare it to your other laps where you're more around the normal speed that you'd be going or lap times you'd be going and then find out what the difference was to gain those sort of two or three tenths. |
| 14:40 | Alternatively, if you've got a friend who's just much quicker than you are, put them in the car, get a reference lap and then you can analyse your data against them. |
| 14:50 | Or alternatively, another really good option is to put a professional driver or a driving coach in your car, normally send one of these guys or girls out for three to four laps and they'll manage to get a pretty representative time that's almost certainly going to be faster than you. |
| 15:06 | Now, while yes that can be a little bit demoralising, realising that your car's actually capable of going potentially two or three seconds a lap quicker than what you're currently capable of, understanding that means that you can then find the reasons for this lack of speed, work on those areas and then get your own improvements. |
| 15:25 | Alright so, we've talked about the different areas of the car performance and driver performance that we want to log. |
| 15:32 | What we'll talk about next is the different systems we can use for logging. |
| 15:38 | While I don't have one here, the first and potentially easiest if you're running an aftermarket ECU is logging into your ECU. |
| 15:47 | This is usually free, kind of, because you've already got the ECU and most ECUs these days that are worth having will have built in logging. |
| 15:57 | But there can be some limitations. |
| 15:59 | This style of logging is very very useful for logging all of your engine metrics, because obviously all of these sensors are already available to the ECU, you've already got throttle position, engine speed, engine coolant temperature, intake air temperature, hopefully you've got wideband lambda and knock. |
| 16:18 | So, everything is there, you've just got to be able to log it and then analyse it at a later point. |
| 16:26 | The limiting factor for this for the likes of a road race application though is by default, most ECUs aren't going to have an input for the likes of GPS or a timing beacon. |
| 16:40 | And why this is important is that without that data, we're not going to have lap time and without lap time, we then struggle to end up with lap positions. |
| 16:49 | So, while we'll be able to see what the RPM and throttle position and everything else was doing, it's not necessarily going to be that easy to find out exactly when that happened, what lap that happened on and whereabouts on the lap. |
| 17:01 | Now, yes, there are options to bring in GPS track timing information or sometimes even a GPS beacon into some ECUs, not all but yes this is an option. |
| 17:14 | But I would say generally the ECU is more relevant for focusing on engine performance rather than chassis and driver. |
| 17:23 | It's just nice that it already has all of those key metrics for engine performance already being logged. |
| 17:30 | The next option is to look at something like a dash logger. |
| 17:33 | So, we'll get our ECU master ADU7 under the overhead here. |
| 17:39 | So, this is just one option, this is a 7 inch full colour display. |
| 17:43 | We see not powered up, not very exciting. |
| 17:45 | It's got the usual driver shift light array as well as the option for some warning lights down the side. |
| 17:52 | These are available from a range of different manufacturers. |
| 17:55 | They all kind of within reason work in a very similar way. |
| 17:59 | We've got the MoTeC C125 as well, which is kind of just a smaller version of exactly the same thing. |
| 18:09 | So, where you're purchasing one of these from, they can be somewhere in the region of maybe $1000 to $1500 USD at the entry level, up to $3000, $4000 USD and above. |
| 18:20 | If you want something a little bit more professional, particularly if we look at the likes of that MoTeC system, MoTeC are well known for their upgrade options. |
| 18:30 | Which is good because if you don't need the upgrade options, you don't have to pay for them, but these can start getting pretty pricey once you start adding in all of the additional features for some of the more advanced functionality that you'd want. |
| 18:45 | Nice thing as well with these dashes is that provided you've got an ECU that can output a CAN data stream, which is these days almost every ECU, it makes it super easy to get all of that engine data from the ECU and input it straight into your dash for logging and analysis at a later point, and as I was mentioning with those temperature sensors, sorry the brake and tyre temperature sensors, it's all on a CAN bar so very very easy to get that data across from your ECU and into the dash. |
| 19:18 | Most of the time, it's as simple as setting up your ECU to transmit the data and then choosing a compatible CAN data stream in your dash logger's setup software and the job is done. |
| 19:32 | Now, admittedly, it doesn't always work exactly that seamlessly, but generally it is about that easy. |
| 19:41 | There are some other options here, which are more along the lines of professional motorsport but for the sake of completeness, let's have a look, we'll jump across to my laptop screen. |
| 19:50 | This is MoTeC's Advanced Central Logger. |
| 19:53 | So, this is more for those who want to analyse a huge amount of data at very very high speeds. |
| 20:02 | I think this one has about a gigabyte of logging memory and can log around 200 inputs or something. |
| 20:09 | However, and it's a big however, is the price point is obviously pretty significant. |
| 20:14 | Straight away, putting it well outside the budget of the enthusiast and honestly unless you're sort of at an OE level and really need to analyse everything in that much detail, this is probably going to simply be overkill for the majority of people. |
| 20:29 | Now, really the key for today's webinar though, everything I've talked about there so far starts at sort of around the $1000 USD mark. |
| 20:39 | And that's still a big chunk of change for someone to come up with. |
| 20:42 | Particularly, when you're probably also going to need some other sensors that'll increase the cost over and above that such as a GPS antenna. |
| 20:52 | So, this is probably one of my favourites at the moment which is the AiM Solo 2. |
| 20:58 | This one is actually the AiM Solo 2 DL, which allows us to get a little bit more data into it but basically it's a completely portable unit. |
| 21:07 | I think the base model of the Solo 2 is around about $400 USD. |
| 21:12 | So, you can see we've got a suction cup here, suction cup to your windscreen. |
| 21:16 | The display will give you some information on your lap time while you're going around the racetrack as well as it will give you a gain or loss function. |
| 21:27 | You can also see compared to a reference lap, whether you're up or down, going faster or slower, the advantage with this is you can kind of do your own driver training from inside the car. |
| 21:38 | What I mean by this is if you load up a good reference lap, maybe one of your decent laps there, which is a good benchmark and then you're in a practice session, you can go out on the track and start experimenting a little bit with maybe your braking points, maybe lines through particular areas of the track and straight away you're going to get feedback from the AiM Solo 2 whether or not your new line choice was better or worse than the previous one. |
| 22:05 | So, it's a really good way of actually being able to train yourself while you're on track rather than doing a whole session, belting around, not really having an idea what was working and what wasn't, then coming back into the pits and having to decide based on your data then what to try next time. |
| 22:21 | So, really really powerful function. |
| 22:24 | So, we need to talk a little bit more about what we actually need to log. |
| 22:31 | And obviously again that's going to be very dependent on which of those three areas we are logging, or wanting to look at I should say. |
| 22:40 | So, we'll start again with the engine, as I mentioned, the engine, not really so much relevant for driver training but it is obviously important to make sure that our engine is A) tuned properly and B) is going to last to the end of the race or session or whatever we're doing. |
| 22:56 | As I mentioned, usually everything we've got there is already, or want to look at, is already going to be input into the ECU, but generally we're going to want to look at engine speed or RPM, intake air temperature, coolant temperature, oil temperature, throttle position, then our oil pressure and fuel pressure, lambda, boost pressure and ideally knock. |
| 23:16 | That's obviously there's a bunch more options in there, but those are going to give you a pretty good idea of what's actually going on. |
| 23:23 | And as I mentioned, all of these sensors generally are already going to be input to the ECU, so often it's kind of a free kit because you don't actually need to go and purchase any sensors but for the sake of completeness, let's just have a look at a couple. |
| 23:37 | So, this is a air temperature sensor. |
| 23:42 | So, we've got a little exposed element in here, this is a negative temperature coefficient thermistor to be very specific. |
| 23:49 | So, basically, it's a two wire sensor, the resistance of this particular sensor will change based on the ambient air temperature that's going across it. |
| 23:59 | One thing with these as well, a little bit off topic but worth mentioning is that a negative temperature coefficient thermistor like this needs to actually be connected to a dedicated analogue temperature input on the ECU. |
| 24:16 | The reason for that is that those dedicated temp inputs will have an internal pull up to the 5 volt rail. |
| 24:23 | Without that, if you just connect one of these up to an analogue voltage input, they won't work unless you hook up an external pull up, because these simply are a variable resistance. |
| 24:34 | So, that's a temperature sensor, very similar for our engine coolant temperature, oil temperature and air temperature. |
| 24:42 | Next, I've got a pressure sensor, this is actually a bit of a cheapy one, I think this is a 50 psi absolute sensor. |
| 24:49 | They all for the most part kind of look the same though. |
| 24:53 | I think this is a 8 1/8th inch NPT thread on it. |
| 24:58 | And they've all got, again most of them have got a pretty similar connector style, these are available from a range of different manufacturers and basically you just choose a sensor based on the pressure range that you want to measure. |
| 25:11 | Also important to understand whether you're buying an absolute or a gauge pressure sensor. |
| 25:17 | Then we've got, this one is a very old style MAP or manifold absolute pressure sensor. |
| 25:24 | This is a GM sensor. |
| 25:26 | These days generally you're gonna be using something that looks a little bit smaller than this. |
| 25:33 | But you just hook up a vacuum line to this and hook that up to your manifold. |
| 25:38 | And you've got a three wire sensor connector here so these work just like the other pressure sensor I showed you with a regulated 5 volt, a zero sensor ground and then our output. |
| 25:50 | Other sensors which are a little bit more advanced, I'll talk about that in a moment actually and then we've got a wideband controller, these come in a range of different styles, shapes, sizes, manufacturers, this is a CAN based controller from MoTeC. |
| 26:05 | Works with a Bosch LSU 4.9 sensor, they also do an NTK version if you want to go that way. |
| 26:13 | This one is an LTCD, which means it's dual, we just have two inputs here. |
| 26:18 | And then this is the connector that goes back to our ECU. |
| 26:21 | Again as I've been mentioning, nice thing with CAN, it's just four wires, 12 volts ground, CAN high and CAN low. |
| 26:30 | Alright so, that's our engine. |
| 26:34 | Let's talk a little bit about our chassis next. |
| 26:39 | So, I've already talked about brake temperature. |
| 26:41 | Brake pressures is also something that's really really helpful to be logging. |
| 26:46 | This allows us to go into a lot more detail in how the driver is using the brakes and how they're modulating the brake pressure. |
| 26:55 | Also, we can then use brake pressures, if you've got a racing style pedal box with a different dual master cylinder for front and rear circuits, you can use two sensors there and that will allow you to monitor the bias as well, the hydraulic bias of the pedal box. |
| 27:14 | On top of that we've also got tyre pressure monitoring systems. |
| 27:20 | So, TPMS, pretty common these days on most late model factory vehicles as well. |
| 27:26 | But allows you to analyse the tyre pressure across a stint. |
| 27:31 | Also can be really helpful to set up some driver warnings for the driver in case perhaps we have a rapid deflation because of a puncture, this can help prevent the driver sort of getting into the braking point at a very fast part of the track, getting on the brakes and then realising that they've actually got a flat tyre, which is not going to end that well. |
| 27:50 | So, a lot of safety in this as opposed to just improving performance. |
| 27:54 | I've mentioned tyre temp and brake temps, as well as our laser ride height sensor. |
| 28:00 | Another one that's useful is a shock travel potentiometer. |
| 28:05 | So, this little guy here, it's just a linear potentiometer. |
| 28:10 | Again a three pin connector, zero to five volts and an analogue voltage output. |
| 28:15 | So, this will allow us, and I'll show you a little bit of data from this, allow you to analyse the performance of the damper and particularly this can be very helpful with optimising our bump and rebound adjustments of our damper. |
| 28:28 | There's a lot more that can be added into this as well in terms of the chassis, but again I want to focus more on the driver so we'll park that and leave it there. |
| 28:38 | Next we'll get into the driver, the key element for today's discussion and really the main one which we're trying to analyse here because everything that we do in the car is really aimed at reducing our lap time. |
| 28:54 | So, obviously we need a way of monitoring and recording lap time. |
| 28:58 | This will then allow us across a long stint to record individual laps and we'll be able to analyse the lap times for those but really the key comes down to finding faster lap times and then trying to analyse why that particular lap was faster. |
| 29:14 | So, as well as the lap time, the sort of two go hand in hand, we also need to know where abouts we are on the racetrack. |
| 29:23 | Because if we're faster or slower at a particular point, we want to know what corner was that in, then we can dive into a bit more detail. |
| 29:31 | So, there's a couple of ways of doing this. |
| 29:34 | Traditionally this all used to be done using two inputs. |
| 29:39 | First of all there would be a timing beacon. |
| 29:41 | This is a physical infrared beacon that was placed on the side of the racetrack. |
| 29:45 | And there would be a receiver in the car that would pick up when the car went past that beacon. |
| 29:51 | So, physical system, nice and accurate, nice and reliable timing as long as the battery doesn't go flat or as long as you don't forget to bring the beacon to the track and put it out, or worse still leave the track and forget to grab the beacon before you leave. |
| 30:05 | But there's a bit of logistics in managing this and quite a bit of cost in having the transmitter for the beacon as well as the receiver. |
| 30:13 | Plus, then you'd also have to be able to swap the receiver from one side of the car to the other depending on where the pit wall was versus the way the car's going past it. |
| 30:22 | So again, a bit of admin to get all of that sorted. |
| 30:27 | These days, much much more likely instead to be using GPS instead of a timing beacon. |
| 30:34 | Now, I will admit that GPS, even if we're looking at some of the newer generation 50 or 100 hertz GPS antennas, yep they're probably not going to be as pinpoint accurate as a physical timing beacon. |
| 30:50 | But generally even with the slower 10 hertz sensors that are kind of the off the shelf sensor that a lot of people will start with, you're going to probably be getting your times within better than a hundredth of a second. |
| 31:06 | So, that's generally, at least at our level, going to be more than ample and the convenience of getting the data this way is also much much higher. |
| 31:16 | These 10 hertz GPS sensors in particular are not very expensive. |
| 31:20 | There's also some disadvantages or problems along doing track mapping using a timing beacon plus wheel speed and lateral and longitudinal G force. |
| 31:33 | So, that's how it was done conventionally. |
| 31:35 | So, we've got the timing beacon so we know when we've gone across the start finish line essentially. |
| 31:40 | Then we're using wheel speed, from this we're deducing distance from the start finish line and then using the longitudinal lateral G force inputs, the logger will be able to know when we're turning a corner and basically draw a nice track map; so that allows us to do all of our analysis on where we were on the track, which corner we were at etc. |
| 32:01 | GPS also does all of that inherently. |
| 32:04 | One of the problems with using wheel speed as well for track mapping is was our wheel speed sensor calibrated correctly? Essentially, have we got the right circumference for our tyre and then of course these can be susceptible to errors creeping in from lock up or wheel spin, but admittedly there are ways that the data analysis can get around some of that. |
| 32:28 | So again, GPS I think is probably the go to for the entry level and the AiM Solo 2, which I was such a big fan of, am still such a big fan of, has GPS built in. |
| 32:40 | So, because this sits kind of on your windscreen, it's got a clear view to the sky above and that will get that GPS signal into it so it knows where abouts you are. |
| 32:50 | Nice feature with the Solo 2 as well is because it has that GPS information, when you turn up to a racetrack it already knows where you are, what racetrack you're at and there's not really a lot of manual effort required from the operator to actually get everything working. |
| 33:05 | You can basically drive out on the track and it should just start producing lap times. |
| 33:09 | So, logging rate for the GPS, as I mentioned, the 10 Hz is probably the entry level and like I said you're probably going to still end up with lap times, if you're comparing this to a MYLAPS style built in transponder system that most racetracks have, you'll be within probably a hundredth of a second in most instances. |
| 33:34 | Sometimes better, sometimes a little bit worse but it's actually pretty damn good. |
| 33:38 | We actually moved to a 50 Hz GPS on our 86, this is a Syvecs GPS, a little bit more money, but the actual lap timing functionality of that wasn't necessarily a heap better, not sort of five times the improvement, but one of the advantages with this was more around accurate tracing of our vehicle speed and that matched up better to our wheel speeds than a 10 Hz, if you get sort of granular, you sort of see the jump, every sort of sample that the 10 Hz sensor has. |
| 34:12 | Which a little out of order is probably worth also talking about logging rates. |
| 34:18 | So, this is simply what it says on the label essentially, how many times a second the logging system will look at that sensor and record the data. |
| 34:29 | And we want to do this at a rate that makes sense for what we're logging. |
| 34:34 | So, for example if we are looking at something like air temperature, clearly our air temperature and our engine coolant temperature, these aren't parameters that are gonna change really really quickly. |
| 34:47 | So, we might only need to log the output from an air temp sensor, maybe two or if you want to get really granular, maybe five times a second, five times a second's probably a bit of overkill. |
| 34:59 | On the other hand, maybe if we want to think about manifold absolute pressure or engine speed, obviously both of those parameters will move much much more quickly than our air temperature. |
| 35:11 | Wouldn't be uncommon to log those sort of channels at maybe 20 or 25 Hz, so 20 to 25 times a second. |
| 35:19 | So, we get a lot more information and we can see exactly what's happening. |
| 35:22 | Then if we look at something like our damper position sensor, these ones if you want to get good data, these need to be logged at more like about 250 to 500 times per second. |
| 35:33 | So, very much dependent on what you're logging as to how fast you need to log that sensor. |
| 35:39 | The importance of this is though that the faster we log the sensors, particularly when we've got a lot of them, obviously that's going to fill up our available logging memory much more quickly. |
| 35:52 | Alright, so our key ones that we've talked about so far is having our lap time and understanding where abouts we are on the racetrack so we can do our track mapping and GPS as one all encompassing sensor is gonna be a really really tidy way of doing that. |
| 36:08 | And just with that one sensor, that can give us so much information and particularly when you are new to logging data analysis, less is more. |
| 36:20 | I know it can be tempting to sort of want to have every sensor known to man, but when you're just getting started out, you really want to be able to focus on just the bare essentials, and then as you get more confident with your analysis capabilities, then you can start branching out and adding more and more sensors. |
| 36:37 | So, starting with less is definitely the way to go. |
| 36:40 | Alright, so what else would we want to add once we've sort of got the finances to do so or the logging and analysis ability to do so? So, some nice to have sensors, one would be brake pressure or at a minimum a brake switch. |
| 36:54 | So, this allows us to see when the driver's on the brakes and if we do have brake pressure, we can then analyse, as I mentioned, how the driver's actually modulating the brake pressure, how quickly they're getting on the brake and how they're releasing the brake pressure as they come into the corner. |
| 37:09 | So, a lot of analysis can be done there and a lot of time can be gained. |
| 37:12 | Gear is nice to have but not essential and this can also be inferred from road speed and engine RPM so not essential, but nice. |
| 37:22 | Steering angle, this is a really nice input to have and can tell us a lot about the balance of the car as well as how the driver is using the car. |
| 37:31 | Things such as understeer and oversteer can be analysed from our steering angle trace. |
| 37:36 | This can be a tricky input to get though. |
| 37:40 | Traditionally, in most analogue style race cars, this is done with a rotary potentiometer and then a little cogged drive and belt from the actual steering column. |
| 37:51 | Alternatively, it can actually be done at the steering rack with something like this, a linear potentiometer, there's a variety of ways of getting this information. |
| 37:59 | These days on late model factory cars though, there's generally going to be steering angle data inside the CAN bus and often we can extract that and basically get this information for free, which is super handy and a really nice way of adding sensors that otherwise can be quite expensive and tricky to get. |
| 38:20 | That's exactly how we got that data using our Toyota 86. |
| 38:24 | The factory electronic power steering outputs, steering angle and as long as we can decode that, that CAN message is really easy to bring in. |
| 38:34 | Last one would be video. |
| 38:37 | It's really nice if we can have video. |
| 38:40 | So, we can kind of sync up the video with our data and see what was actually happening, what the driver was doing, importantly where the driver was placing the car on the track at the time. |
| 38:52 | So, a lot of information can be gleaned from that and yes I know these days, GoPros are relatively cheap and accessible. |
| 39:00 | The problem with it is that while it's not impossible, syncing up GoPro data to data logging and data analysis can be pretty tricky, pretty cumbersome and I tried this and after probably about two or three months of race events I kind of gave up on it and we went with a bespoke video capture system that just integrated seamlessly with our data. |
| 39:24 | Now, how do we get all of this information in? So, again just focusing on the entry level product here, our AiM Solo 2, as I mentioned, this one here is the DL, which allows us to also bring in CAN data from maybe our ECU. |
| 39:42 | Again kind of the process of doing that is just as easy as I explained. |
| 39:46 | But also if we jump over to my laptop screen here, this is information from AiM's website for Solo 2 and Solo 2 DL and what we can see here is you do also have the ability to have a CAN expansion unit, so you can bring in four other channels there, whatever sensors you want and just add these in via CAN so nice and easy. |
| 40:10 | And then as well, AiM offer their SmartyCam 3 or SmartyCam which allows you to bring in video really easily, obviously there is going to be a price hit for that convenience. |
| 40:25 | But basically what I'm saying is this little unit, which sort of starts at $400 USD, you can grow with this and add to it as time goes by. |
| 40:34 | Another nice feature with this which I reckon is a real benefit is if you've got maybe another mate or a couple of mates that are attending track days as well, pull your money, buy one of these and then you can swap it between cars, between sessions, it's just so easy. |
| 40:50 | It is literally just a suction cup. |
| 40:53 | So, literally no reason not to have one of these if you're intending to be serious about track days. |
| 41:00 | Right, I'll just head back across to my notes here for a second. |
| 41:03 | Alright, so that covers the mainstream inputs that I think are worth considering. |
| 41:16 | And again just to reiterate, we can start with nothing more than just GPS track position and lap timing, that data is still going to give us a huge amount of information. |
| 41:27 | We're going to go into looking at some data in a moment so this is a good time to remind you if you've got any questions, please start asking those and we'll get into those once we've had a look through this data. |
| 41:40 | Now full disclosure here, I am going to demonstrate this using MoTeC's i2 Pro analysis software, which obviously works with their particular loggers. |
| 41:50 | That's not to say that it's the only software to use, it's just one that I am very familiar with, the important point to take away here is that while every data analysis package is going to have its own look and feel, the menu structure's going to be different, generally the actual data and the way we can present the data is going to be very similar across these different platforms. |
| 42:13 | So, what you'll learn here as we go through this MoTeC i2 platform is going to still be relevant if you're using the AiM Solo 2 for example. |
| 42:22 | So, let's have a look at i2 Pro. |
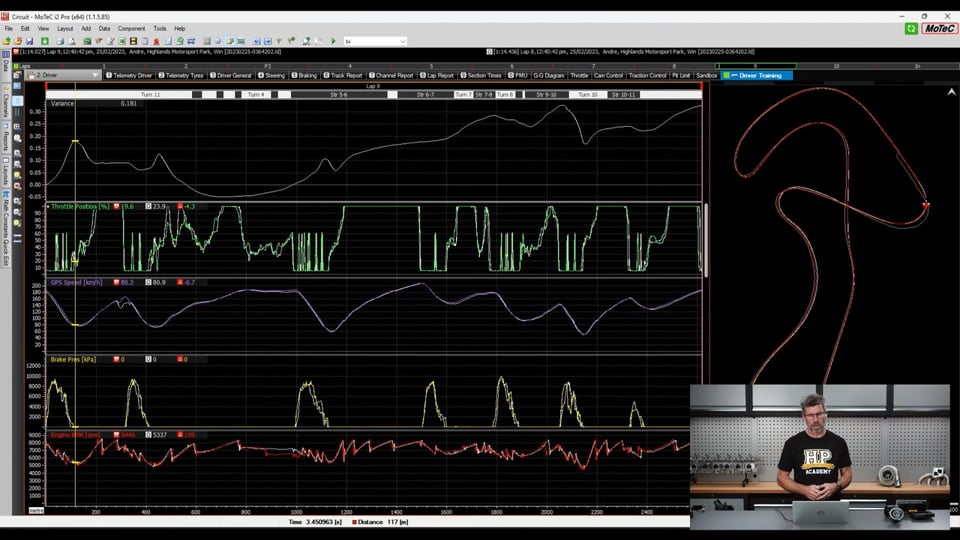
| 42:25 | And straight away we've got some squiggly lines which is always a great place to get started, but let's just understand what we're actually looking at here. |
| 42:33 | So, this is some data from a race at our local racetrack, Highlands Motorsport Park. |
| 42:39 | Let's not get overwhelmed about it, because as we already know, our car has a huge number of sensors on it, that's not always going to be the case. |
| 42:48 | So, let's start by heading over here, we've got a little fly out box here which says data. |
| 42:54 | And this shows us the entire session here so we have all of our laps and our individual lap times being displayed here. |
| 43:03 | And by clicking on these, I can swap between all of these laps. |
| 43:08 | Straight away it shows me for this session, lap 9 was my fastest, I did a 1 minute 14.027. |
| 43:15 | And generally, when we're starting to analyse our data, it's always a good place to start with our fastest piece of data. |
| 43:22 | But as you can see, very easy here just to pop around and have a look at each of the individual laps. |
| 43:28 | Another really powerful, probably the most powerful aspect of data analysis packages like this is the ability to overlay two laps of data. |
| 43:38 | And this might be two of your own laps or as I mentioned earlier, maybe a reference lap from a pro driver or essentially just someone who is faster than you are, that's all it needs to be. |
| 43:49 | So, for example, here we've got our 14.027 lap loaded up as our main. |
| 43:54 | Let's have a look here and we've got our 14.177, not far behind but still slower. |
| 44:01 | We can click this little box here and it will bring the overlay lap up and all of the channels will be displayed but these will be grey. |
| 44:10 | Now, I'll just get rid of that for a moment and let's go back out of our data. |
| 44:14 | So, that's how we can manipulate and look at all of our laps. |
| 44:17 | Alternatively, up the top bar graph here, we can again see all of our individual laps. |
| 44:24 | And we can see at the moment that the one that we are looking at that's filling up the screen there is lap nine. |
| 44:30 | We can simply double click, oh sorry we can't, we can move forwards and backwards with these laps as we see fit. |
| 44:39 | Basically, jump through all of our laps, N will be our next lap and P will be our previous lap, F and B will move us forwards and backwards. |
| 44:48 | So we can basically manipulate the data that we're looking at in a range of different ways depending on what we actually want to look at. |
| 44:55 | Alright next, what data are we analysing? Now that we know what lap we're on, and actually let's just get us back to our fastest lap here. |
| 45:06 | So, we've got a range of worksheets and workbooks, which is MoTeC lingo but again most platforms will have very similar options. |
| 45:13 | We can see here that I'm at the moment on a suspension analysis worksheet. |
| 45:18 | So basically, this gives us all of these, sorry that's a workbook, gives us these worksheets here that are relevant to that particular area of analysis. |
| 45:29 | And we can make these up, we can change them, add to them, remove them as we see fit. |
| 45:33 | So, we've got just the data that we want for a particular area of analysis and nothing we don't. |
| 45:39 | So, let's get into something a little bit simpler. |
| 45:42 | If we click on the drop down menu here we can see all of our workbooks. |
| 45:46 | And let's come down to driver. |
| 45:49 | And this is where we can get a little bit more granular with the information that we're looking at. |
| 45:57 | So, here we've got some very simple data. |
| 46:00 | On the right hand side we've got our GPS track map of Highlands Motorsport Park. |
| 46:04 | So, we can see where abouts we are on the track. |
| 46:07 | The individual channels that we're analysing, we've got our throttle position here at the top. |
| 46:13 | We have got our GPS speed. |
| 46:17 | Then we've got our brake pressure. |
| 46:19 | I will just mention if you're looking at these numbers at some point and you're sort of thinking to yourself what on earth does this mean because we've got a value of 8268, this is just a raw number coming out of the Toyota 86 ABS system so another nice feature just like the steering angle, we didn't need to go and add brake pressure sensors to our 86, this information is available on the bus, but it's not necessarily scaled. |
| 46:45 | We've also got engine RPM down at the bottom. |
| 46:48 | Ok so, this is kind of sort of a bare bones in terms of the information that we would need. |
| 46:56 | Brake pressure, probably not strictly necessary but it can be a really beneficial addition to the mention. |
| 47:05 | Alright so, let's see how we can go about analysing the performance of the car at a very basic level. |
| 47:13 | And we'll go back up to our data and we'll bring back in our overlay. |
| 47:16 | So, let's have a look at a lap that was a good chunk slower. |
| 47:21 | So, our lap eight and we'll bring that up as an overlay here. |
| 47:25 | So, what we really want to understand is that everything we do in the car when we're trying to improve our lap times is all about improving this channel here, our GPS speed or just our speed trace. |
| 47:39 | Obviously the higher we can have our speed trace on average, the faster the car is going to be around the track. |
| 47:46 | So, you can see with this overlay, the grey overlay is kind of a little bit slower, if we look at this area here, it's a little bit slower than the main overlay. |
| 47:57 | So, what I can do is click on any particular point and now that I've got this overlay, it'll show us a couple of bits of data. |
| 48:03 | So, it shows us here the main channel, the main lap I should say, the speed at that particular point I just randomly chose was 187.2 kmh and we can see that the overlay is significantly slower at 182.6. |
| 48:19 | More importantly, we could just look at this variance channel here and see that we're going to be 4.4.5 kmh faster on our main or slower on our overlay. |
| 48:28 | So, these are the sort of things that we're looking for. |
| 48:31 | Another area here we can kind of straight away glimpse exactly the same issue through this particular area which we can see also, it'll always show us where abouts we are on the track so I know this is actually coming out to the entry to a bridge. |
| 48:45 | So, we can see at that particular point, our overlay is 3.4 kmh slower. |
| 48:51 | Alright so great way of analysing our data, because we can see where we were faster or slower. |
| 48:57 | A more powerful way of doing this though is with a channel called the variance or delta channel. |
| 49:04 | So, I can do this in the i2 Pro software by pressing the F3 button. |
| 49:07 | So, what this shows us is where we were faster or where we were slower compared to our reference lap. |
| 49:16 | So, we've got a line through here at zero so basically if the two laps were the same, we're just gonna sit through that zero. |
| 49:24 | What we can see here though is that in this particular area, we were faster on our main. |
| 49:30 | And what we're actually looking for is not just where the variance is going in the direction we want, so where we're getting a gain in time, what we're also looking for is where the variance is steepest. |
| 49:43 | So, we can see here, that's quite a steep angle to our variance. |
| 49:47 | Likewise, probably got another area here that's pretty steep. |
| 49:51 | The steeper it is, what that means is that we're gaining or losing time more quickly. |
| 49:57 | So, let's have a bit of a look here and see why that's the case. |
| 50:00 | So, I'll just come across to the left a little bit. |
| 50:03 | And this part here, let's just dive into that in a bit more detail. |
| 50:08 | So, what I can do is double click, basically expand on this particular area. |
| 50:12 | And what we can see here is this all really starts to go wrong for the overlay in the braking area. |
| 50:20 | So, what we can see here, we roll off the throttle and in this particular case, we were off the throttle about 5m earlier on that overlay. |
| 50:34 | So, I've got down here our distance, so this is from the start of the lap. |
| 50:38 | So, we're actually still talking 12m before the start of the lap. |
| 50:41 | But that's 12m there and if I click on our overlay, we're about 17. |
| 50:48 | So, basically we rolled off the throttle about 5m earlier coming into this braking zone. |
| 50:55 | We can also see, if we're looking at our brake pressure, so I've got the benefit of brake pressure here, but even a brake switch, whether it's on or off, is going to give you a lot of the same detail. |
| 51:05 | We can see that again we got on the brakes, in this case it's going to be 4m earlier. |
| 51:10 | So, we're braking sooner and what that shows, the difference here is right through this braking area, the whole time essentially we're under braking, we are gaining time on that main because the speed, the purple line is consistently 8 km, 8.5 km, 9.4 km, 7.2 km faster. |
| 51:33 | That is what is giving us this gain, our variance is increasing so we are gaining time with our main. |
| 51:41 | Interestingly enough though, what we can see is that mid corner, so about this speed here, we're actually down to essentially almost an identical speed, depending where I click around, I mean we're within a kilometre an hour or 1.5 km an hour. |
| 51:56 | So basically, what that says to me is that we've actually managed to do a better job of the braking performance. |
| 52:04 | We've braked later, but we've actually still bled off to the same int speed at the apex of the corner. |
| 52:12 | So, basically just simply doing a better job of the braking. |
| 52:15 | So, I can press W, that'll take us back out to the whole lap. |
| 52:18 | So, why it's important to understand the variance channel is first of all it tells us straight away where to look, where to analyse. |
| 52:29 | The other aspect with this though as well is that we don't want to overload ourselves with information. |
| 52:37 | So generally, if I'm doing some driver coaching, I'll look at one of my laps and I'll look at maybe one of Ben's laps and I'll try and find two or at the absolute most, three areas where we've got the sharpest angle to our variance and give information on what to change in that area of the track. |
| 52:56 | If you start trying to focus on every single corner of the racetrack, that's just going to be too much information, it's going to be a complete overload and it's not going to be helpful. |
| 53:06 | So, just to reiterate, variance channel, one of the most important channels to look at, huge amount of information there, not just the variance though but the steepness of that variance will tell you where you're gaining or losing the most time. |
| 53:21 | Next thing I wanted to talk about here is what's called a GG diagram. |
| 53:28 | And I've got one of these set up here. |
| 53:30 | Let's just get rid of our overlay data for a moment. |
| 53:34 | So, what this does is basically continually logs our lateral and longitudinal G force and it will basically log all of this information and display it in this scatter graph like this. |
| 53:48 | So, it shows us how well we're managing to exploit the grip from the tyre. |
| 53:53 | So, if we're looking here, basically this is our minimum and maximum lateral G, we're sort of pulling about 1.7 G in one direction and 1.8 G in the other direction. |
| 54:07 | So, that's cornering. |
| 54:09 | We've also got our acceleration, which up here, 0.8 G which seems pretty optimistic but I'll take it. |
| 54:18 | And then under braking we're sort of down, we've got this little outlier here at sort of 1.7 G. |
| 54:24 | So, the important point is that for an amateur driver like myself, it's pretty easy to optimise braking in a straight line, particularly if you've got ABS, I mean you can treat the brake pedal like a switch and let the ABS do all of the hard work. |
| 54:40 | And that should, for the most part, get us down around here. |
| 54:43 | The problem is that we aren't just braking and coming to a stop in a straight line, what we're doing is we're braking, getting the speed bled down and then we'll trail brake and basically start reducing our braking to allow us to turn into the corner. |
| 54:57 | And the tyre can do one of two things, it can produce maximum lateral grip, so cornering grip, or it can produce maximum longitudinal grip for braking or acceleration, but it absolutely cannot do all of those things together. |
| 55:12 | What I mean by this is if we are at the absolute limit of the tyre's adhesion under braking and we want to turn into the corner, we have to do something to free up a little bit of grip to allow the car to start turning or in other words to allow that tyre to start producing some lateral grip and start to turn the car into the corner. |
| 55:31 | And as we want to turn the car more and more, we need to release the brake pedal more and more so that the tyre is then concentrating only on our lateral or cornering force. |
| 55:43 | So, that kind of is the way that we ride the rim of this, we're starting here on the maximum braking and then we're sort of heading around here and to the point where at this point we are now at maximum lateral grip and there'll be no additional potential for that tyre to provide acceleration or braking. |
| 56:04 | Then as we start coming off the corner, we're going to start opening the steering, so then the tyre has a little bit of additional grip and then we can start riding that rim back around here and to the point where back on the neck straight away we are zero steering and we're under full acceleration. |
| 56:21 | So that's what the GG diagram gives us. |
| 56:23 | The key though is just how well we're exploiting this edge or rim of the GG diagram. |
| 56:32 | And I would say that in this area here, I'm probably not doing the best job. |
| 56:38 | And this is an area that I absolutely could be improving on. |
| 56:42 | So, this GG diagram gives you a really really visual way of analysing this and understanding whether you're doing a good job, an average job or somewhere in between of actually exploiting the tyre's grip. |
| 56:54 | Those two aspects alone are probably the areas that I would start by focusing on, because they're very very simple to understand, particularly that variance channel. |
| 57:06 | They don't need additional inputs. |
| 57:09 | You're going to have lateral and longitudinal G force inside your dash, inside your logger and you've also got GPS track timing etc. so basically everything you need, nothing you don't. |
| 57:23 | For the sake of completeness, I will just look at a couple of more advanced concepts here, seeing as we've got everything laid out in front of us. |
| 57:32 | And the first of these is just looking at our brake performance. |
| 57:35 | So again, if we come into our workbooks here, let's come down to workbook five which is our brakes. |
| 57:41 | So, we've got our general, I know I've got two general ones here but that's fine. |
| 57:46 | What we've got here, brake bias setting, let's just get rid of that. |
| 57:52 | Close and we don't have our brake pressure front, let's get rid of that as well. |
| 58:03 | Ok alright, so we've got our engine speed, probably not strictly necessary for monitoring this, we've got our four individual wheel speeds along with our GPS speed. |
| 58:14 | We've got our G force longitudinal, obviously the one that's most important here for our braking performance, don't really care about cornering. |
| 58:23 | We've got our brake pressure, which is that same non scale channel here that I've already talked about and then we've got our brake temperatures. |
| 58:31 | So, we've got as I mentioned, two front, two rear. |
| 58:34 | Straight away you can see from this as well, what I was talking about before, that they aren't exactly the same side to side on the front and the rear axles. |
| 58:41 | What we can see as well, if we just choose one particular point here, let's go for this one here, which is a bit of a higher braking point. |
| 58:49 | So, we've got our brake pressure, we can see that driver gets on the brakes pretty quickly. |
| 58:54 | That gives us minimum longitudinal acceleration about minus 1.3 G at that particular point. |
| 59:04 | And we can see the vehicle speed is scrubbing off here as we are hard under brake. |
| 59:11 | So, what we get, we start that braking area, you can see how the front brake temperatures have nicely dropped away as we've gone down a straight, we've got that airflow after the last braking exercise. |
| 59:24 | So, we're starting that at about 640°C and our peak temperature at this point, 820°C. |
| 59:32 | Actually, probably a little bit higher than I'd like. |
| 59:34 | We can see what our brake temperature's getting to. |
| 59:39 | This will allow us to understand, first of all, particularly over a longer stint, let's just zoom out and we'll sort of have a look at that. |
| 59:47 | We can see the sort of trends over a stint, we start obviously rolling out of the pits with our brakes pretty much at room temperature. |
| 59:55 | We can see the general shape to this. |
| 59:58 | The key point is making sure that at some point we actually end up with a plateau, because particularly for an endurance race, it's not going to be too much help if after 10 laps of racing our brake temperatures continue to climb to the point where we get brake fade, so that's not going to work too well. |
| 01:00:14 | Yeah so, allows us to also match the brake pad compound to the temperatures that we are seeing. |
| 01:00:23 | Some brake pad compounds will work really really well at lower temperatures, but fall off a cliff in terms of their coefficient of friction once the temperature gets higher. |
| 01:00:33 | Or vice versa, we see brake pads generally that will work very well at high temperatures, may not offer too much in the way of braking at all when they are stone cold. |
| 01:00:45 | So, a little bit of understanding of that's really important here. |
| 01:00:48 | Let's just come back to lap nine and then we can see how much lower our rear brake temperatures are, we're only sort of seeing peaks here. |
| 01:00:57 | I'll actually mention another feature, if we press the M key, that'll give us our minimum, our maximum and our average so those numbers all pop up for every channel over here. |
| 01:01:06 | So, we can see in this case our right rear, our maximum was 308 versus our left rear was 388 so a bit of a variation there. |
| 01:01:18 | And our minimum, 234 versus 245, so great sort of snapshot of seeing a whole bunch of data very quickly. |
| 01:01:26 | Last one, and again I'll just mention if you've got questions, please ask those, because we'll get into those in just a second. |
| 01:01:31 | Last one I wanted to talk about was, oh actually we can also set up a brake temperature rainbow which is not very well set up so we can see at a glance on the track what our brake temperatures were, nice way of visually analysing data really quickly. |
| 01:01:46 | But I wanted to just go to our suspension workbook here and talk a little bit about what we've got on here. |
| 01:01:53 | So, if we come across to our first worksheet, this is our suspension positions. |
| 01:01:57 | So, we can see all of those here, really important with suspension position as well, that we make sure that they are correctly zeroed. |
| 01:02:08 | So this is quite a bit, particularly once you get into more advanced setup like our Toyota 86 endurance car with a lot of sensors, it kind of becomes a bit of a case of garbage in, garbage out so it's really important to make sure that all of our sensors are calibrated and the likes of our ride height sensors are all properly zeroed before we roll out of the pits, otherwise we could be looking at some data that's not going to be overly useful. |
| 01:02:34 | So, from suspension position, we can, or the software will work out suspension velocities. |
| 01:02:41 | So, we don't have to do any heaver lifting there but this is the rate of change of the, or movement of the dampers in millimetres per second. |
| 01:02:51 | And then from here, the other really valuable chart that, or graph that MoTeC offer is our suspension histograms. |
| 01:03:01 | So, basically this is looking at our damper velocity in both bump and rebound. |
| 01:03:07 | And this is one of the most powerful tools for tuning bump and rebound on our dampers. |
| 01:03:13 | Ideally, what we should be getting, if our bump and rebound are correctly tuned, we should kind of end up with something that looks a little bit like this, kind of a normal distribution curve I guess and it's not skewed in one direction or another. |
| 01:03:27 | So, this is what we can see here on our right rear. |
| 01:03:31 | A little bit more skewed so not quite right there. |
| 01:03:35 | Obviously every lap's different, a lot of it's going to depend on do we run a curb on this particular lap, gathering data in a way that is going to be useful is obviously pretty important here, but yeah this can gain us a lot of insight into whether our dampers are properly tuned in terms of the bump and rebound settings. |
| 01:03:53 | Now again, this is definitely a much more advanced function and definitely is not where I would suggest you get started, but just for the sake of completeness, because we've got the ability to show you, I thought I would. |
| 01:04:06 | For now we'll jump into our questions and again if you've got any more, keep them coming. |
| 01:04:16 | First question from Lil MRL,"Is data still stored after a long period of battery disconnecting?". |
| 01:04:23 | Yeah, this is stored in non volatile memory so you're not going to lose the data if you power the unit down. |
| 01:04:32 | I'd say that's probably the case for any data logging system that I've used. |
| 01:04:37 | They do have their own different ways of how they store it, but generally it's not something that's going to disappear if the battery goes flat. |
| 01:04:46 | That being said there is also quite a bit involved in data management, because understandably you're going to be producing a lot of log files, you know on average weekends you might get maybe two or four practice sessions, maybe a few qualifying sessions and maybe two to five races, so each of those sessions is creating a lot of data. |
| 01:05:08 | It's really really important to keep track of this by being pretty diligent with the way you download that data straight away, how you name it so that you can know coming back to it if anything was going on or useful just for referencing it at a later point. |
| 01:05:23 | And then also how you store that data on your laptop so it's going to be accessible at a later point. |
| 01:05:30 | And the more data you're analysing, the more important this becomes. |
| 01:05:34 | Next question, "My second GoPro recently died and I didn't really want another. |
| 01:05:38 | What would be your next best suggestion for a motorsport video capture device?". |
| 01:05:42 | You know what, I kind of probably downplayed the availability of these, but there's actually not that many. |
| 01:05:50 | We're running a MoTeC VCS or video capture system in our little CRX, which will probably also get switched across to our 86. |
| 01:05:59 | But that is irrelevant for two reasons, one it's cringingly expensive and two, even if you've got the budget for it, for some unknown reason MoTeC have actually discontinued it so that is no longer an option. |
| 01:06:12 | The AiM SmartyCam seems to be producing some really good results. |
| 01:06:18 | A colleague of mine uses one of those in his racecar, he's actually gone to the trouble of reverse engineering the CAN data stream so that it's compatible with, I think he's running a MaxxECU and a MoTeC dash so he's got kind of all three different systems, but he's managed to make that work. |
| 01:06:38 | Obviously, if you are running something like an AiM system, integration with that is going to be absolutely seamless. |
| 01:06:44 | Don't ask me what they're worth, because I don't have one but I have liked what I have seen with that particular product. |
| 01:06:51 | Next question, "Is there a software package that permits data files from AiM Datalog to be used in MoTeC i2 and vice versa?". |
| 01:06:58 | Yes, you can purchase a licence from MoTeC that will allow you to analyse datalog files from other platforms in their software. |
| 01:07:11 | Which is kind of helpful, because as I kind of mentioned at the start of this webinar, the reason I showed the i2 analysis system is it's the one that I am most familiar with. |
| 01:07:22 | And no matter what system you become familiar with, you kind of learn all of its quirks and the quick shortcut keys et cetera, you just end up knowing your way around it. |
| 01:07:31 | So, learning multiple systems can sort of have a bit of a time penalty while you get up to speed. |
| 01:07:37 | So yeah, it's worthwhile if you are wanting to analyse files in MoTeC's i2, looking at one of those licences. |
| 01:07:47 | I don't know, it's been a long time since I've done this, I don't know if they offer that for every single platform, that would probably be a little bit difficult but I think they do have a licence option so that a generic. csv file which most data loggers can export in, can be analysed. |
| 01:08:06 | So, that would be an easy solution there. |
| 01:08:10 | Last question, Osger has asked, "I'm using DIY electronics that can log data with comma separated values, do you know of any software to process CSV files or make it viewable to any professional datalog viewers?". |
| 01:08:23 | I think I probably just answered that question. |
| 01:08:26 | The other one that I use quite a bit is Megalog Viewer HD and that will open any. csv file and it is in its own right an incredibly powerful system. |
| 01:08:36 | Alright, looks like that's all the questions we've got so we will leave it there. |
| 01:08:41 | As usual if you are watching this in our archive at a later point and you've got further questions, please ask those questions in the forum and I'll be happy to answer them there. |
| 01:08:50 | And we'll see you all next time. |
0:00 Introduction
1:00 - Why data logging & analysis?
2:41 - Engine performance & health
4:52 - Brake & tyre thread sensors
10:28 - Advanced engine health sensors
13:07 - Driver performance & training
15:38 - Logging through aftermarket ECU
17:30 - Dash loggers
20:52 - AiM Solo 2 logger
26:39 - Chassis sensors
28:38 - Driver related monitoring
34:24 - Logging rates
36:49 - Nice to have sensors
39:46 - Bringing all the data together
44:55 - What data to analyse?
57:23 - Advanced concepts
1:04:06 - Q&A